Local dependency
The RADIUS hostname cannot be resolved through the DNS resolver at one site.
 MeilleurControl
NOC & Control Monitor
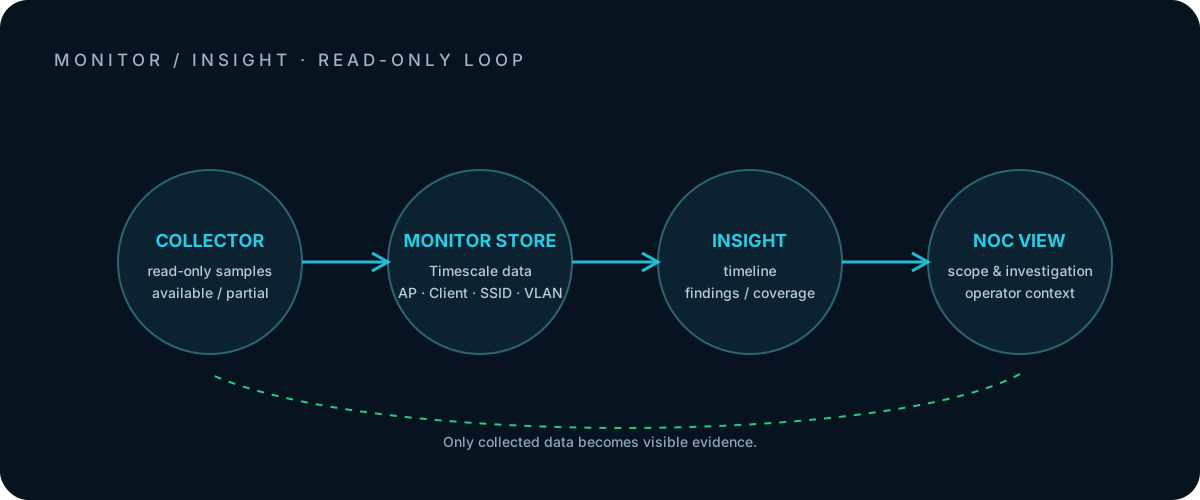
Many network problems develop gradually. Monitor makes states and changes visible over time and preserves the technical context for later analysis, from site and AP down to client, SSID, VLAN, RF, and infrastructure evidence.
Local context
Checks can run in the context of a site, AP, SSID, or VLAN. This reveals whether DNS, DHCP, NTP, RADIUS, NAC, or cloud services work exactly where they are needed.
The RADIUS hostname cannot be resolved through the DNS resolver at one site.
The SSID is active, but credentials, vouchers, or time-limited access are no longer valid.
New APs cannot reach the cloud because of certificate manipulation or firewall rules.
Part of the site shows unusually long lease times or intermittent failures.
Historical context
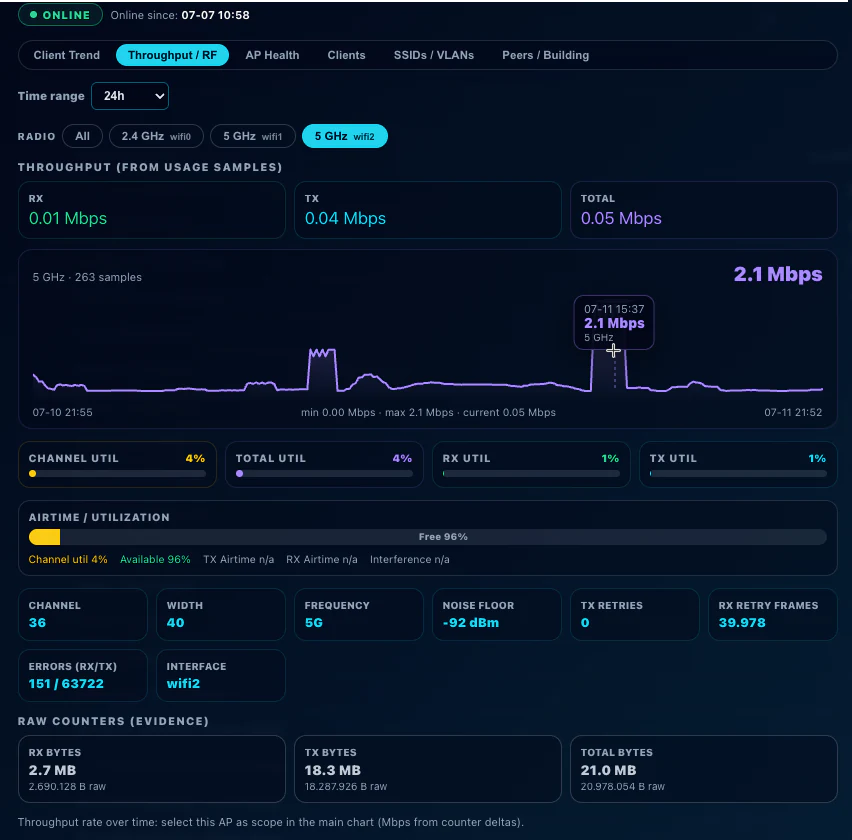
The issue is gone today. Yesterday at 18:00 it was real. That is when the NOC needs more than a live snapshot and a guess.
From site to radio
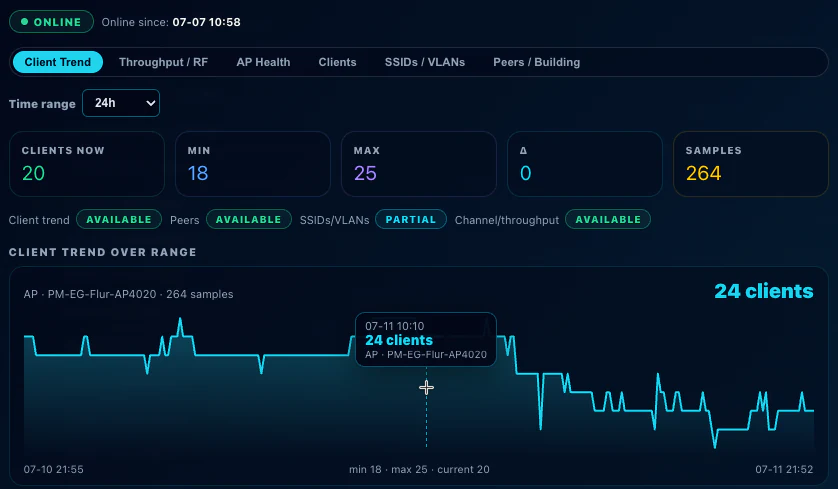
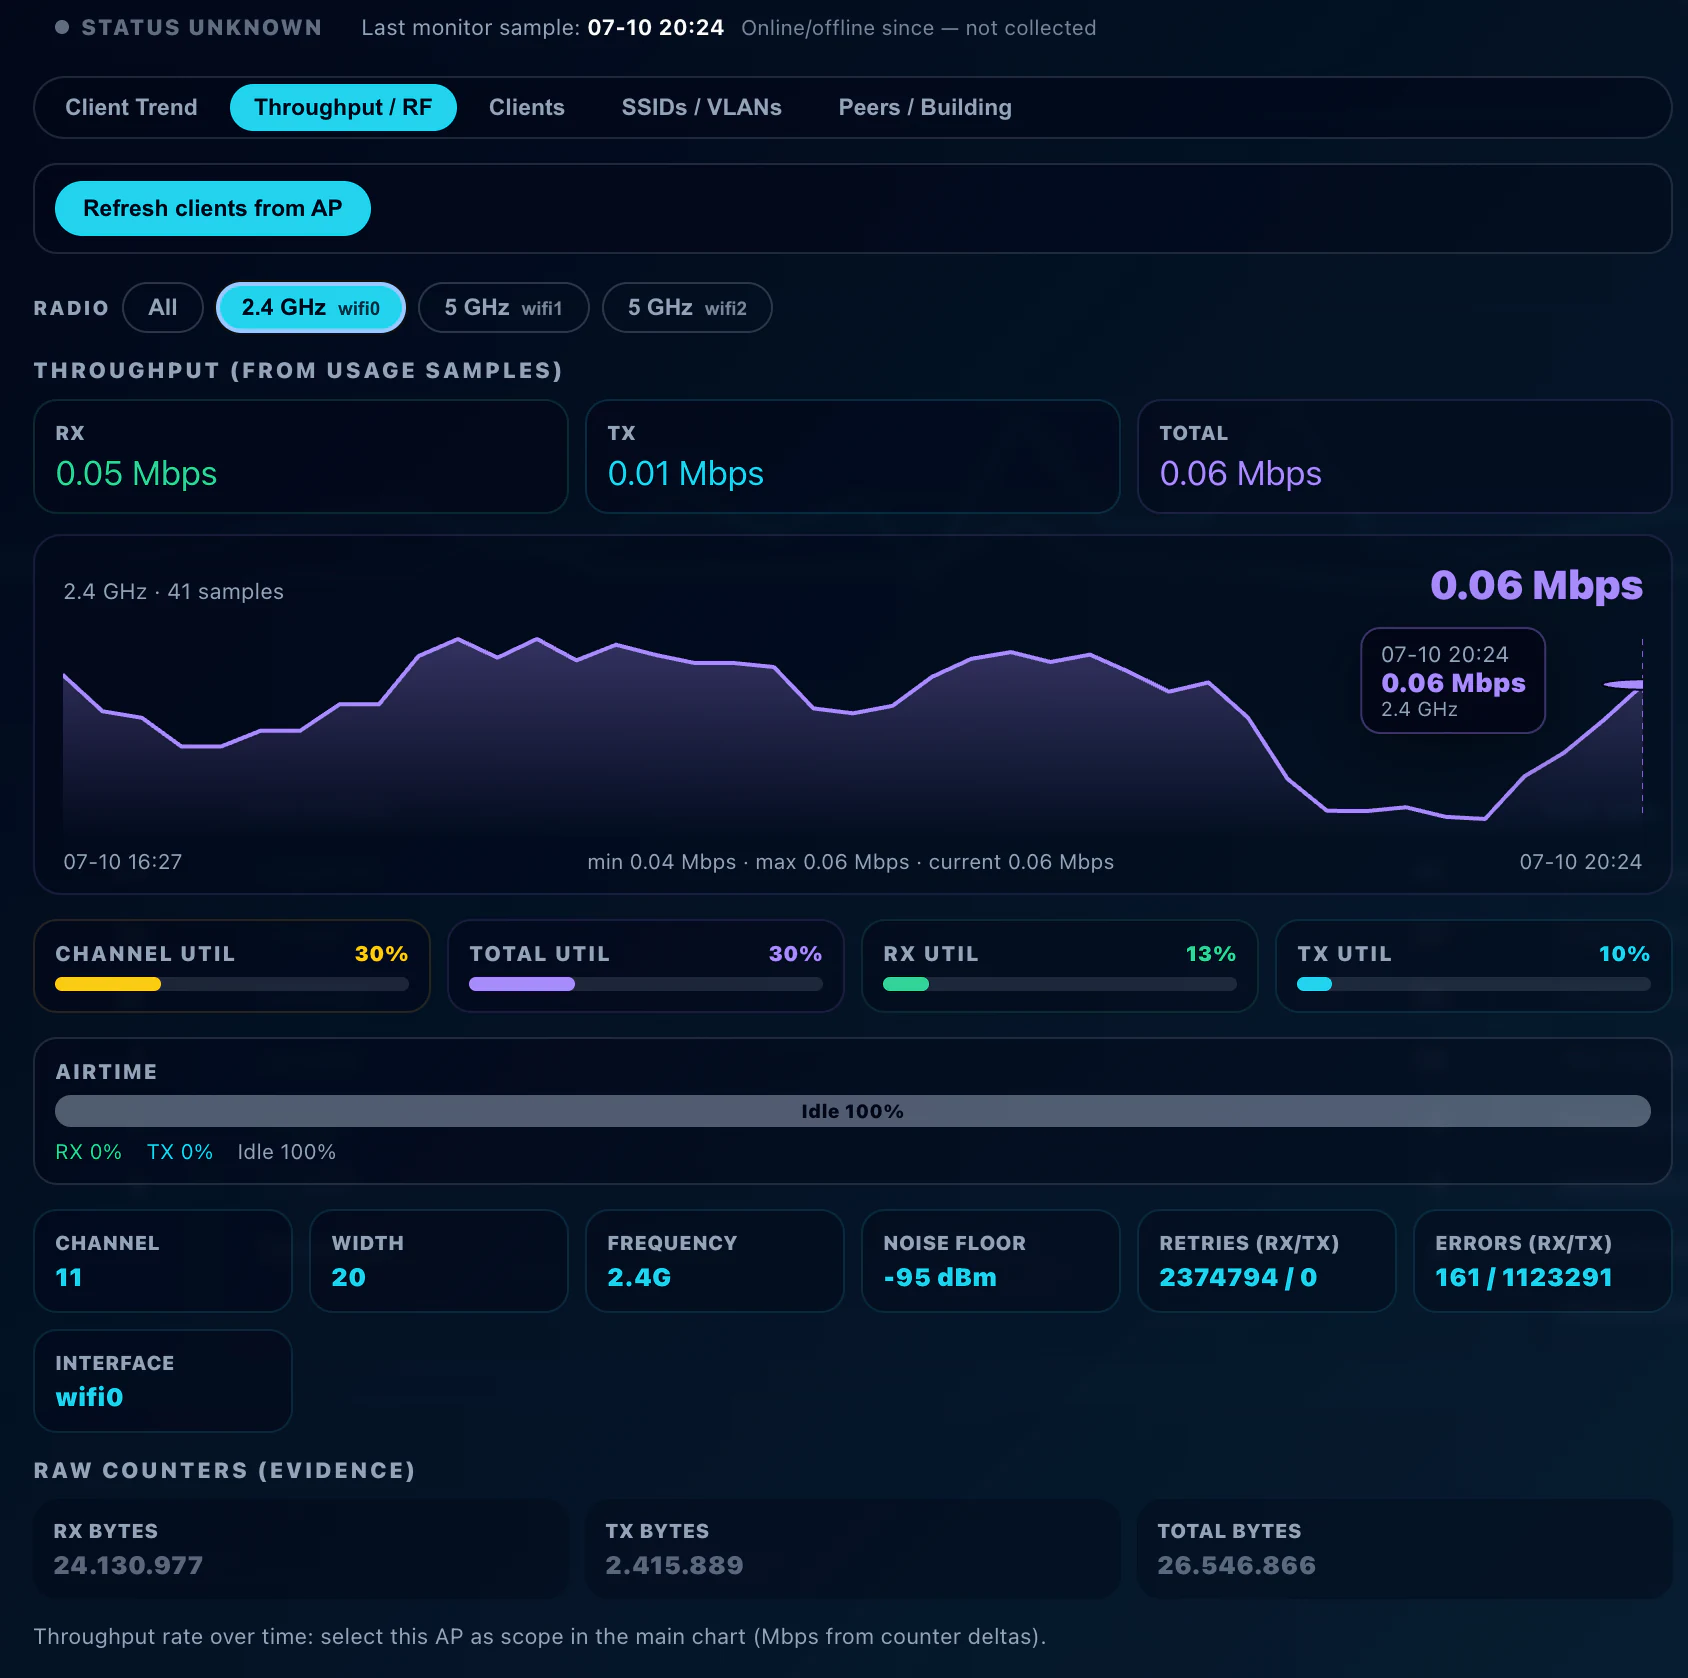
OK, warning, and critical states can be narrowed down to the site, building, AP, client, SSID, VLAN, radio, and switch port.
AP and site context
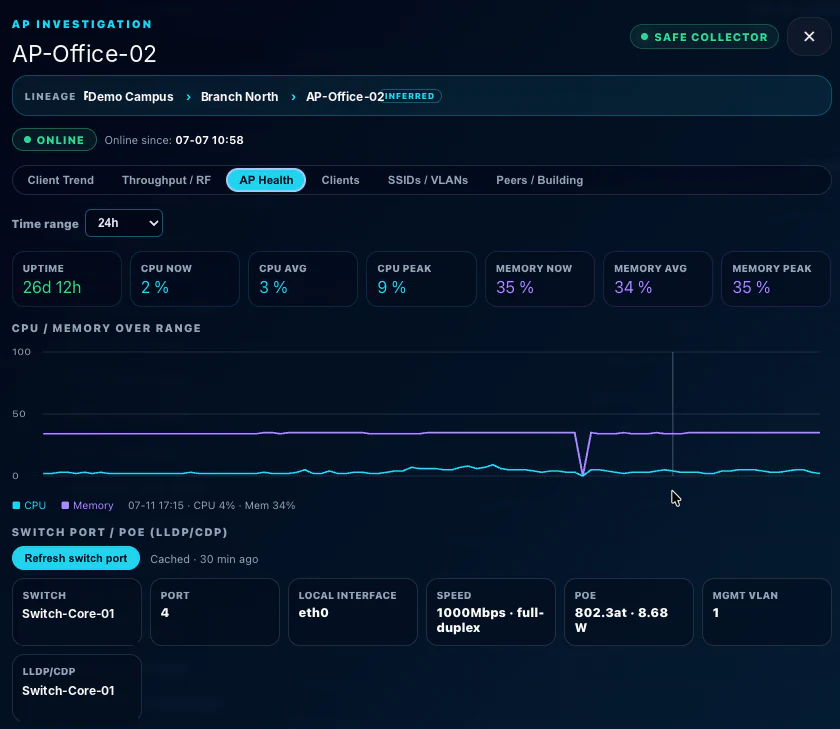
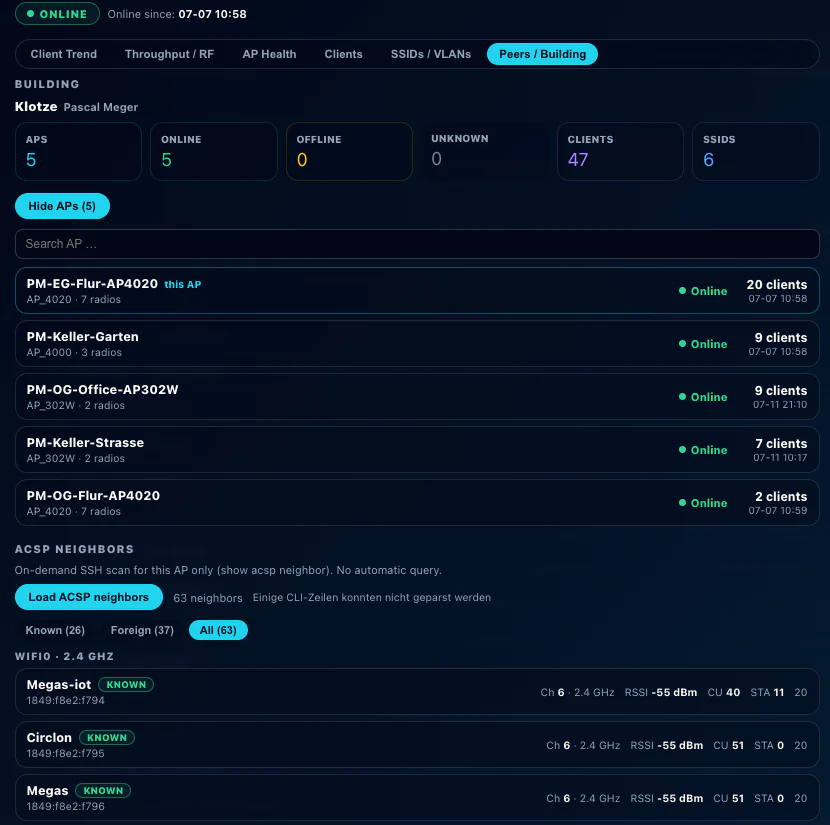
AP health combines CPU, memory, uptime, PoE, link speed, duplex, and switch-port data. Building, peer, and neighbor context shows whether an anomaly originates at the AP, within the building, or in the local RF environment.
Structured handoff
Control structures status, scope, severity, and evidence for reporting and machine-readable handoff. A local ServiceNow outbox foundation is prepared, but automatic remote incident creation or updates are not currently available as a production feature.
Data provenance
Control shows the data source and collection time. Teams can distinguish between live values, stored samples, and signals that were not collected, allowing historical conclusions to be assessed with technical confidence.
Proactive operations