DNS works—just not where it matters.
The RADIUS server in Miami is reachable, but the local resolver in Rio cannot resolve it. DNS appears healthy globally, yet authentication still fails at that specific site.
 MeilleurControl
Network Operations & Intelligence
Meilleur Control brings monitoring, diagnostics, technical evidence, and reporting into one operational view. From the central NOC down to an individual access point, Control shows not only that something is wrong, but where it starts and which data supports the diagnosis.

One platform. One technical context.
Sites, APs, clients, services, and infrastructure in one investigation instead of scattered across separate tools.
Explore the platform → 02 Control MonitorLive state, time series, and historical context down to AP, client, SSID, VLAN, and RF environment.
View Monitor → 03 Beam AgentActive service tests, local data collection, and evidence from the exact location where the issue occurs.
Explore Beam → 04 Companion AppMobile workflows for field engineers to test, compare, document, and share results.
Explore Companion →From status to cause
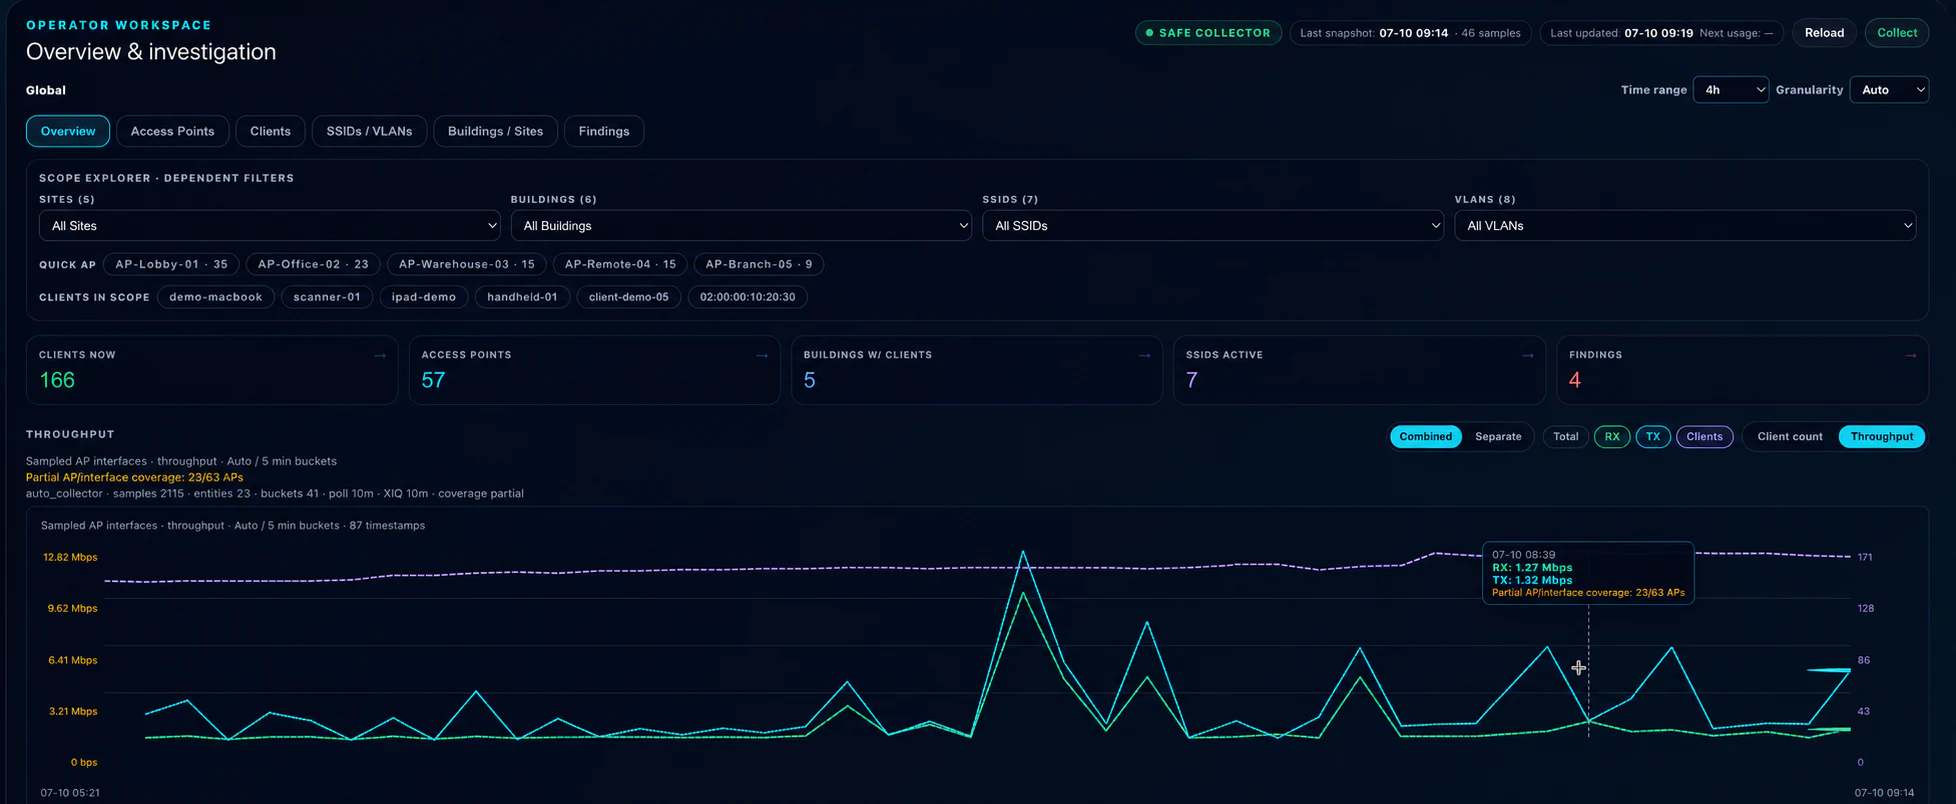
Control keeps site, access point, client, service, RF, and infrastructure context in the same investigation. The NOC can see where an issue begins, which dependencies are affected, and what evidence supports the next useful step.
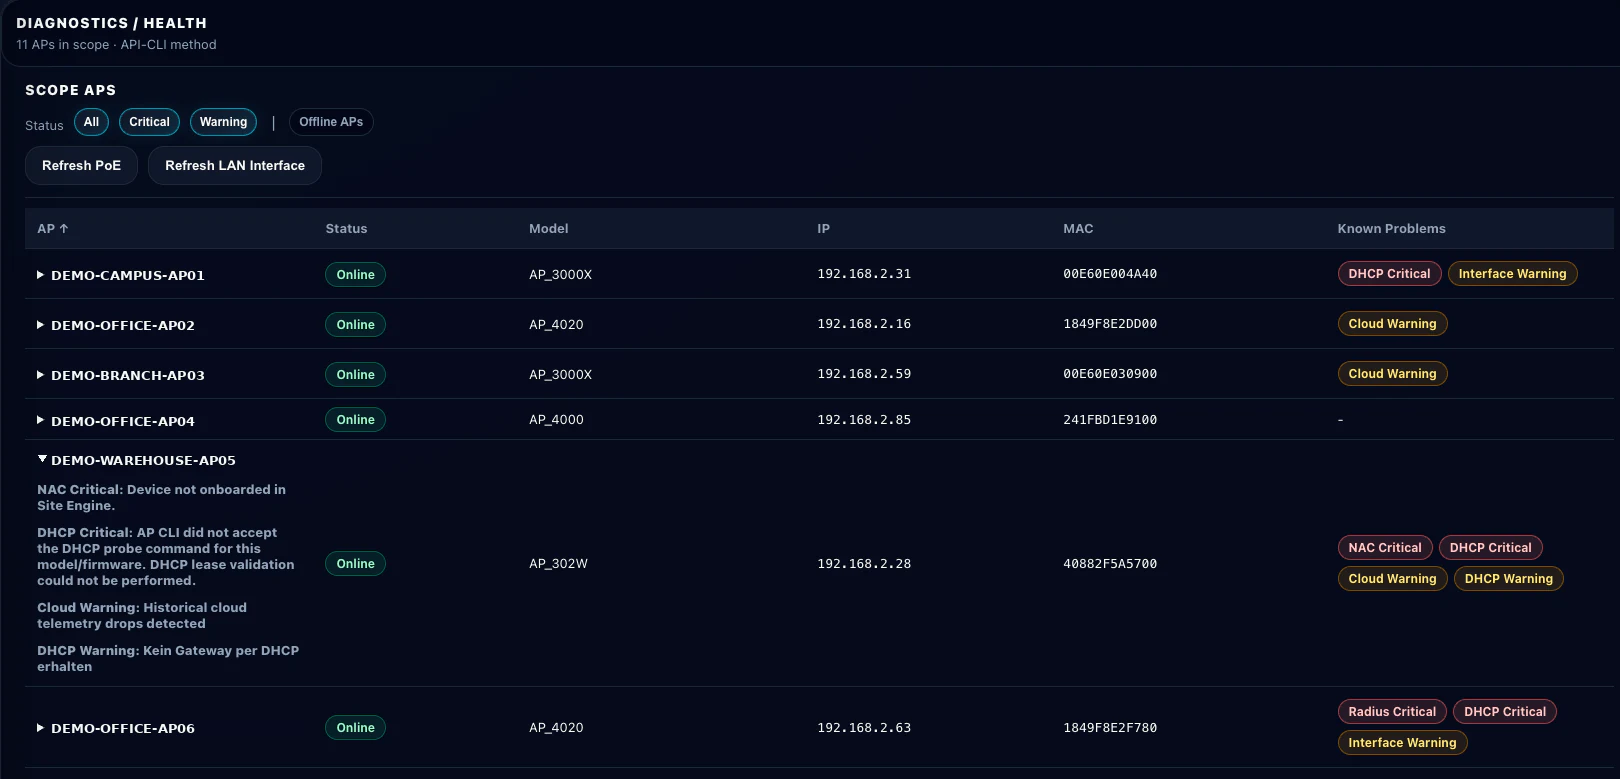
Slow DHCP may be a service issue—or the result of CRC errors, drops, insufficient PoE, a duplex mismatch, excessive airtime, or unstable cloud communication. Control brings all of these signals into the same scope.
When global green is not enough
What matters is what happens at the affected site: which VLAN, SSID, client, access point, and dependency are involved. Control exposes local deviations that can disappear inside a global overview.
The RADIUS server in Miami is reachable, but the local resolver in Rio cannot resolve it. DNS appears healthy globally, yet authentication still fails at that specific site.
The access points are online and the SSID is being advertised. Only when a client attempts to connect does it become clear that credentials, policy, or time-limited access are no longer valid.
SSL inspection alters certificate chains or a firewall blocks required destinations. Existing devices appear stable while new access points cannot reach the cloud.
CRC errors, drops, insufficient PoE, or a speed/duplex mismatch can surface as slow DHCP, interrupted application sessions, missing telemetry, or repeated client reconnects.
From signal to action
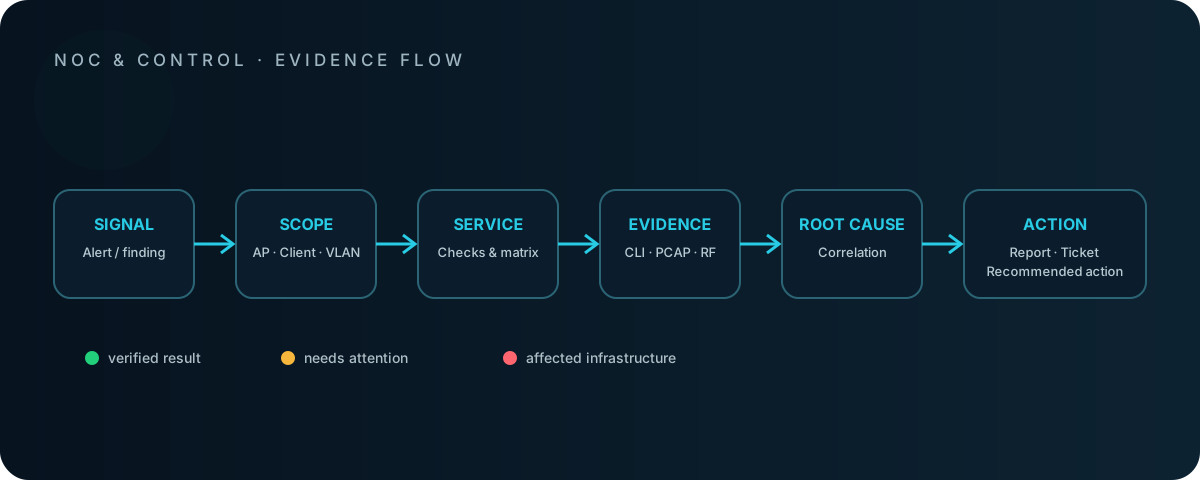
Control combines live context, service tests, and infrastructure evidence in one workflow.
One investigation context
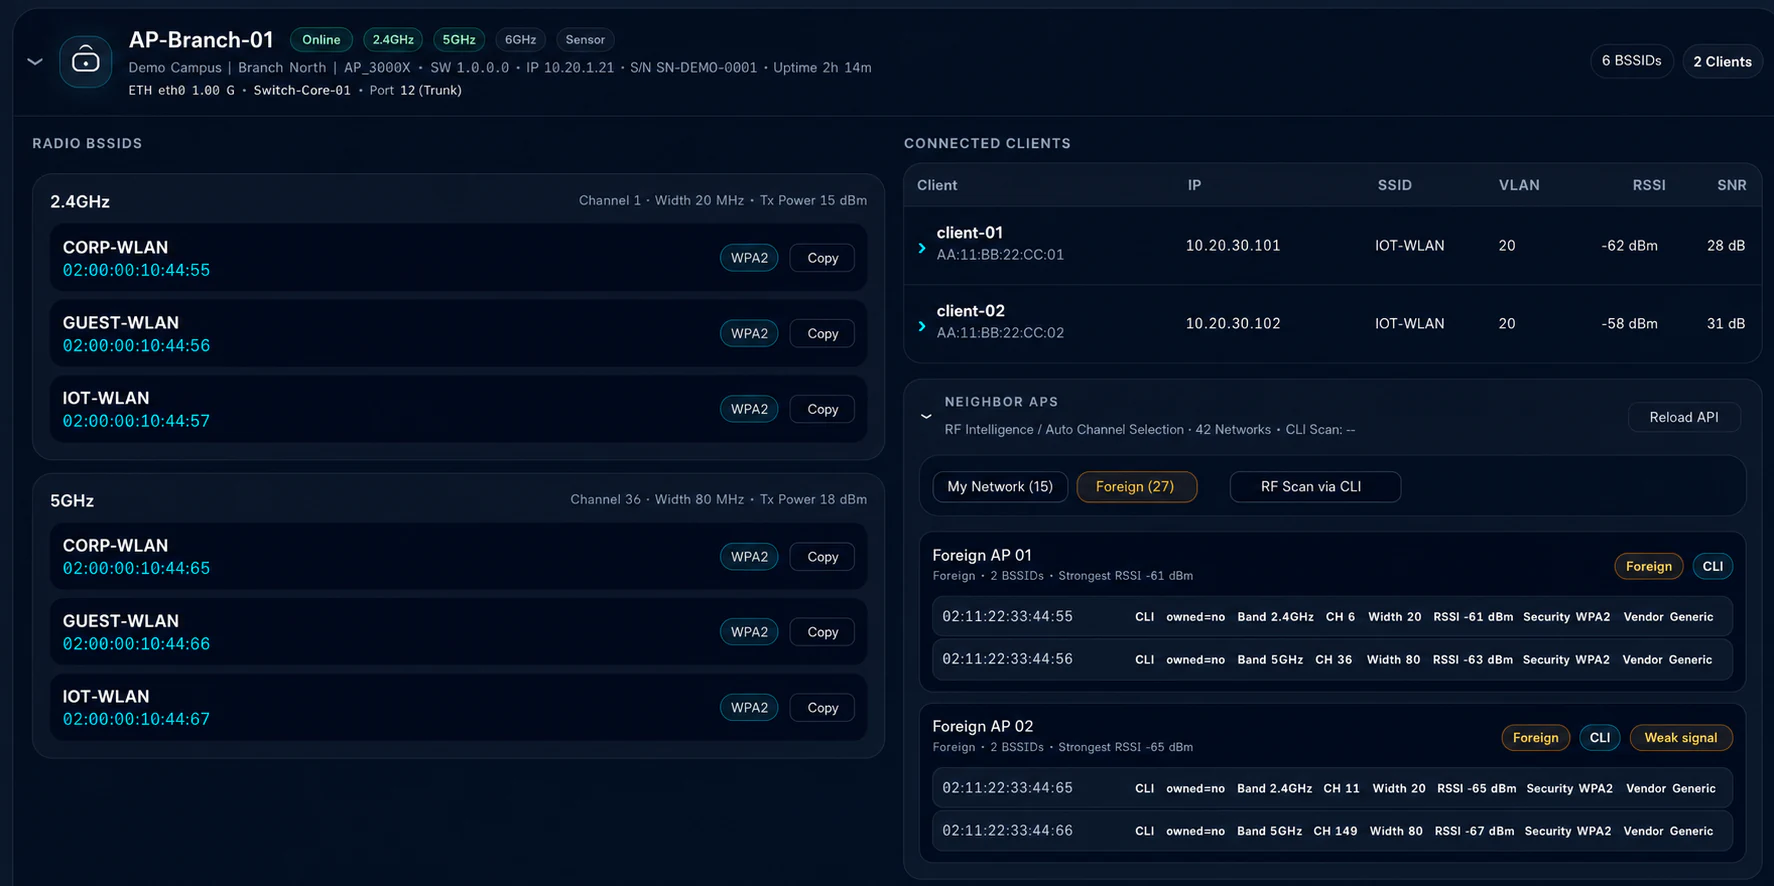
APs, clients, sites, buildings, SSIDs, VLANs, NAC, switch ports, and services stay part of the same investigation. The technical context does not disappear when you move from overview to detail.
Historical context
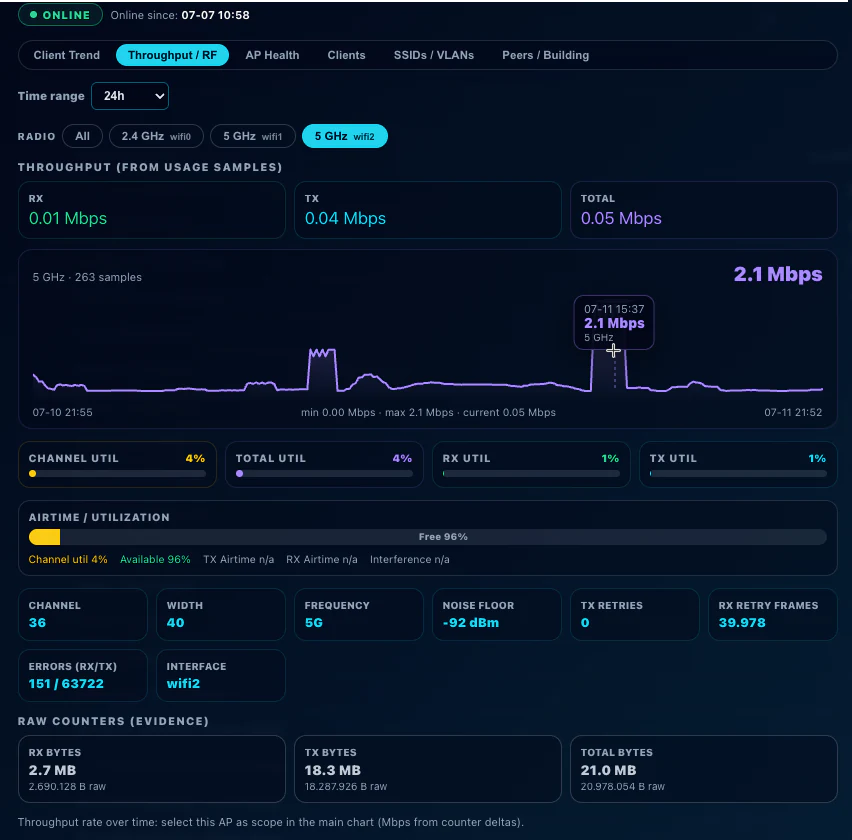
An issue was reported but has since disappeared. Monitor preserves the timeline: client count, CPU, memory, channel utilization, retries, noise floor, CCI, service state, and available infrastructure evidence.
A clean technical handoff
Reports keep tested services, affected infrastructure, technical evidence, root-cause correlation, and recommended next steps together. The next team receives a traceable technical finding, not an alert stripped of context.
