Site to client
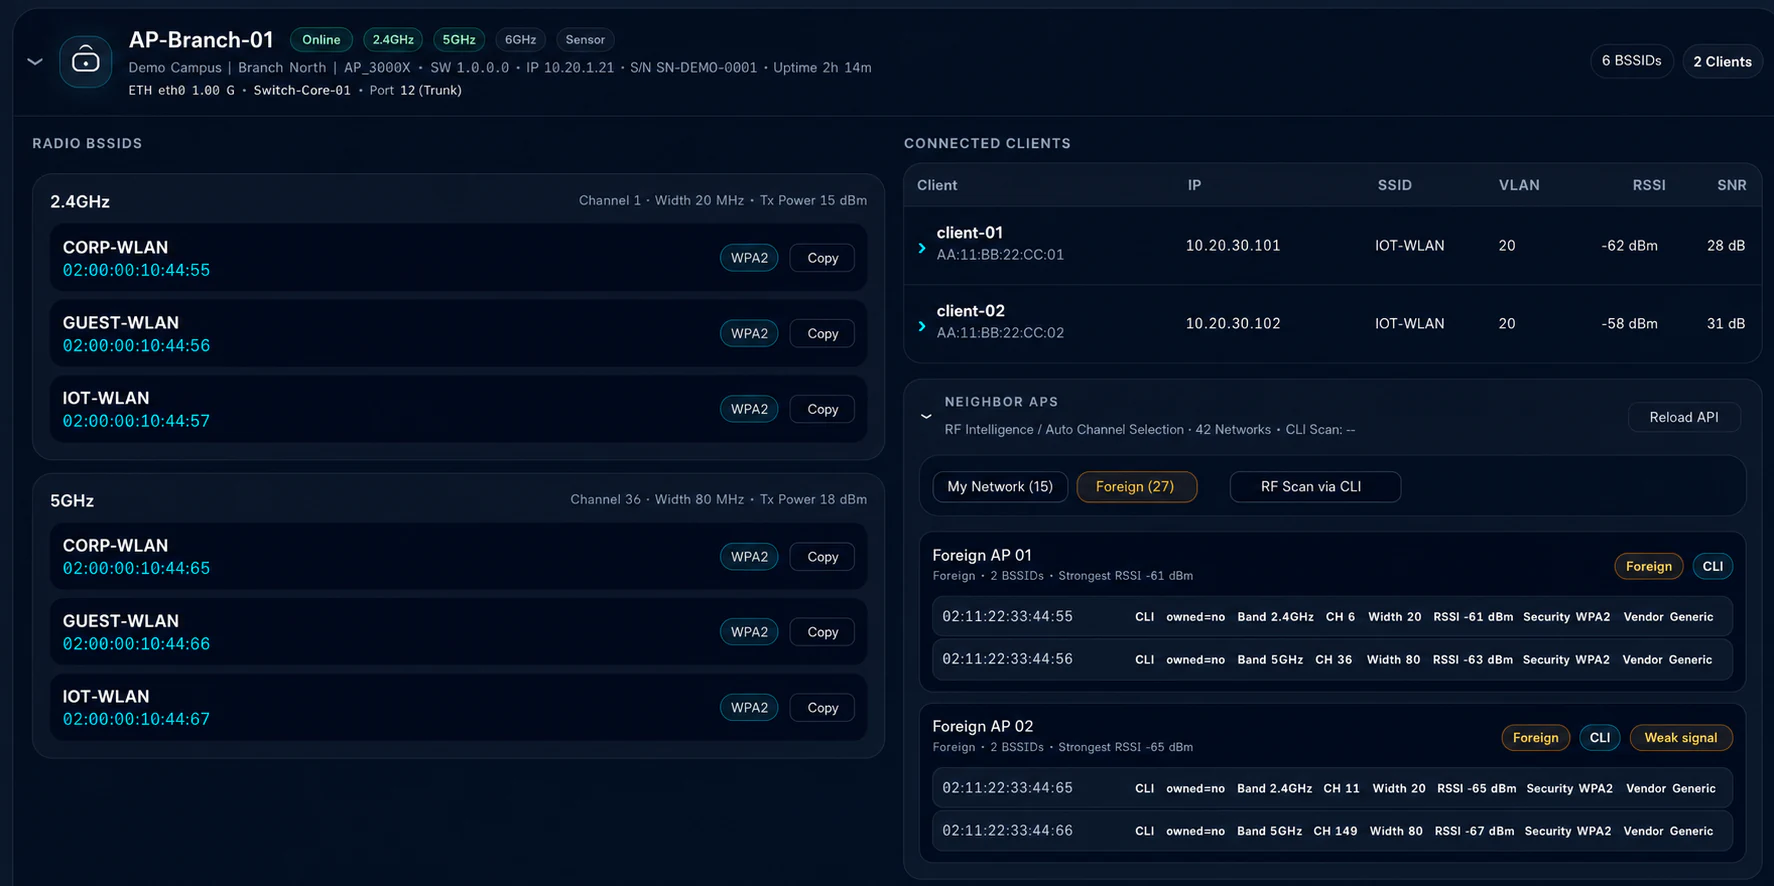
Global site overview, site, building, AP, SSID, VLAN, and the exact client session.
 MeilleurControl
Guided Product Demo
The Control demo presents a complete operations workflow using synthetic data—from a site-level finding and AP or client investigation to service checks, evidence, root cause, and report.
Credentials for an online live demo account are available from the Meilleur team.
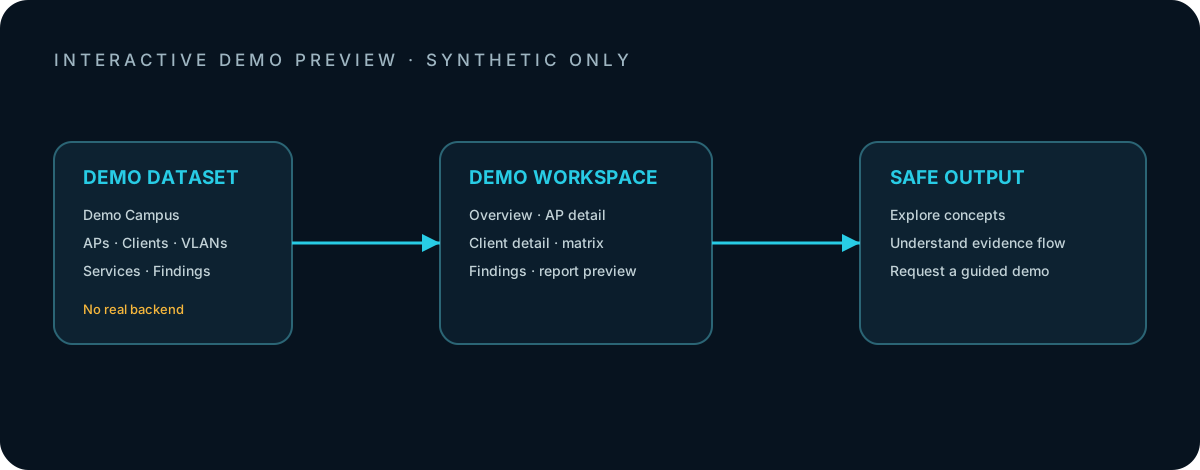
What you will see
Global site overview, site, building, AP, SSID, VLAN, and the exact client session.
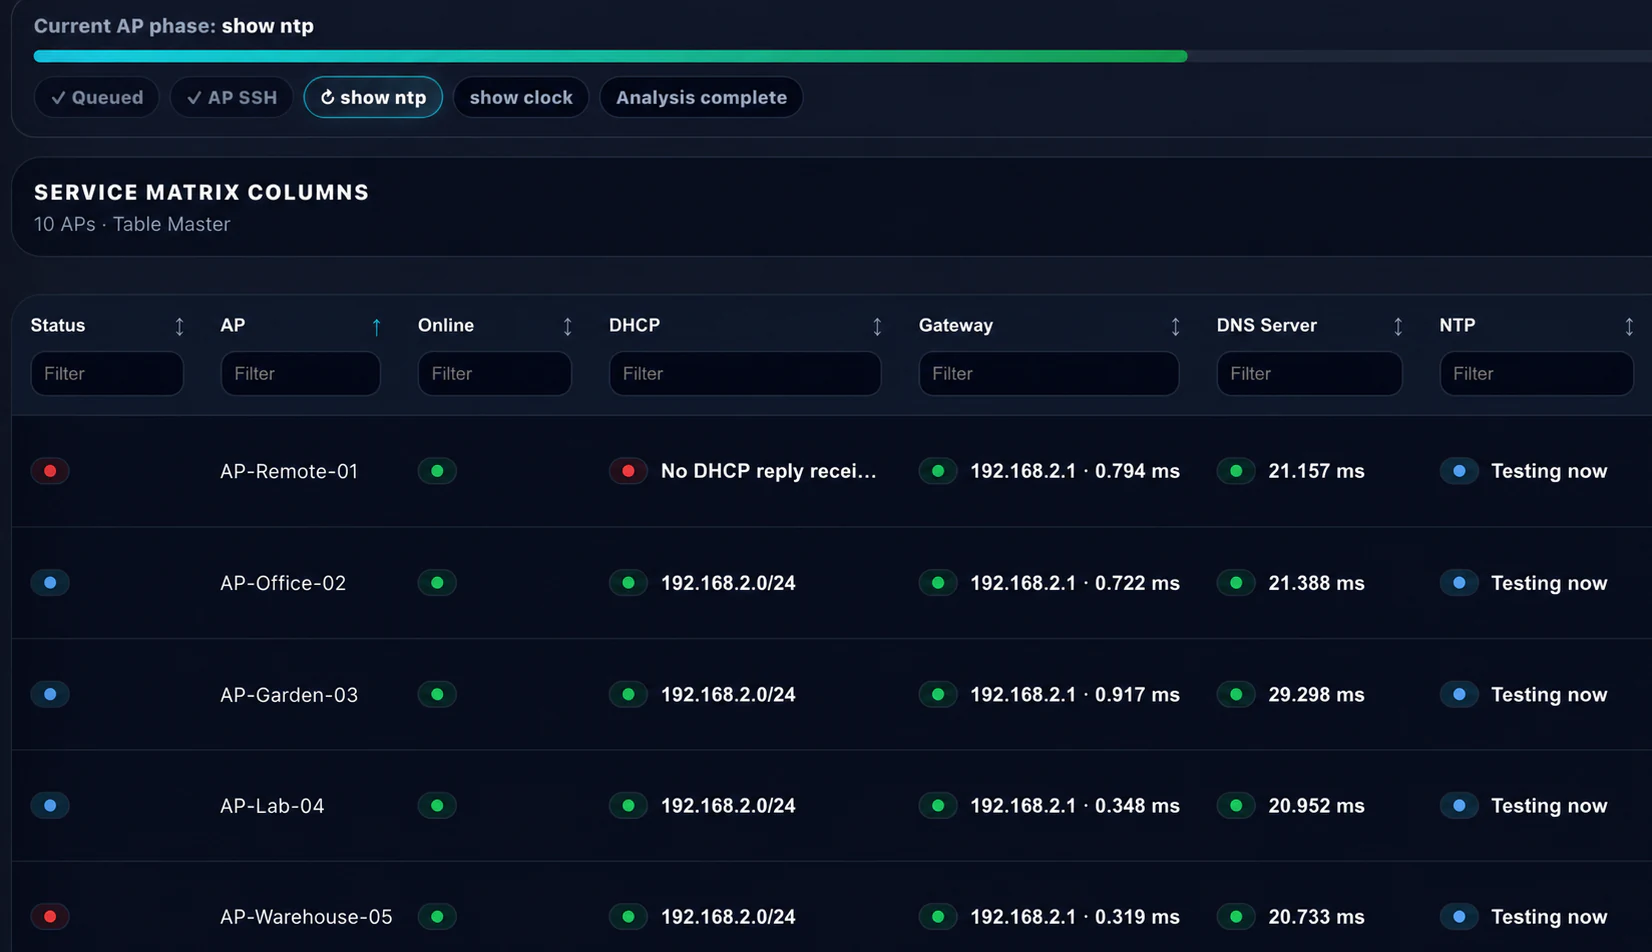
DHCP, DNS, NTP, RADIUS, NAC, cloud, RF, neighbors, and switch port in the same case.
Timeline, client count, throughput, CPU, memory, retries, errors, and site status.
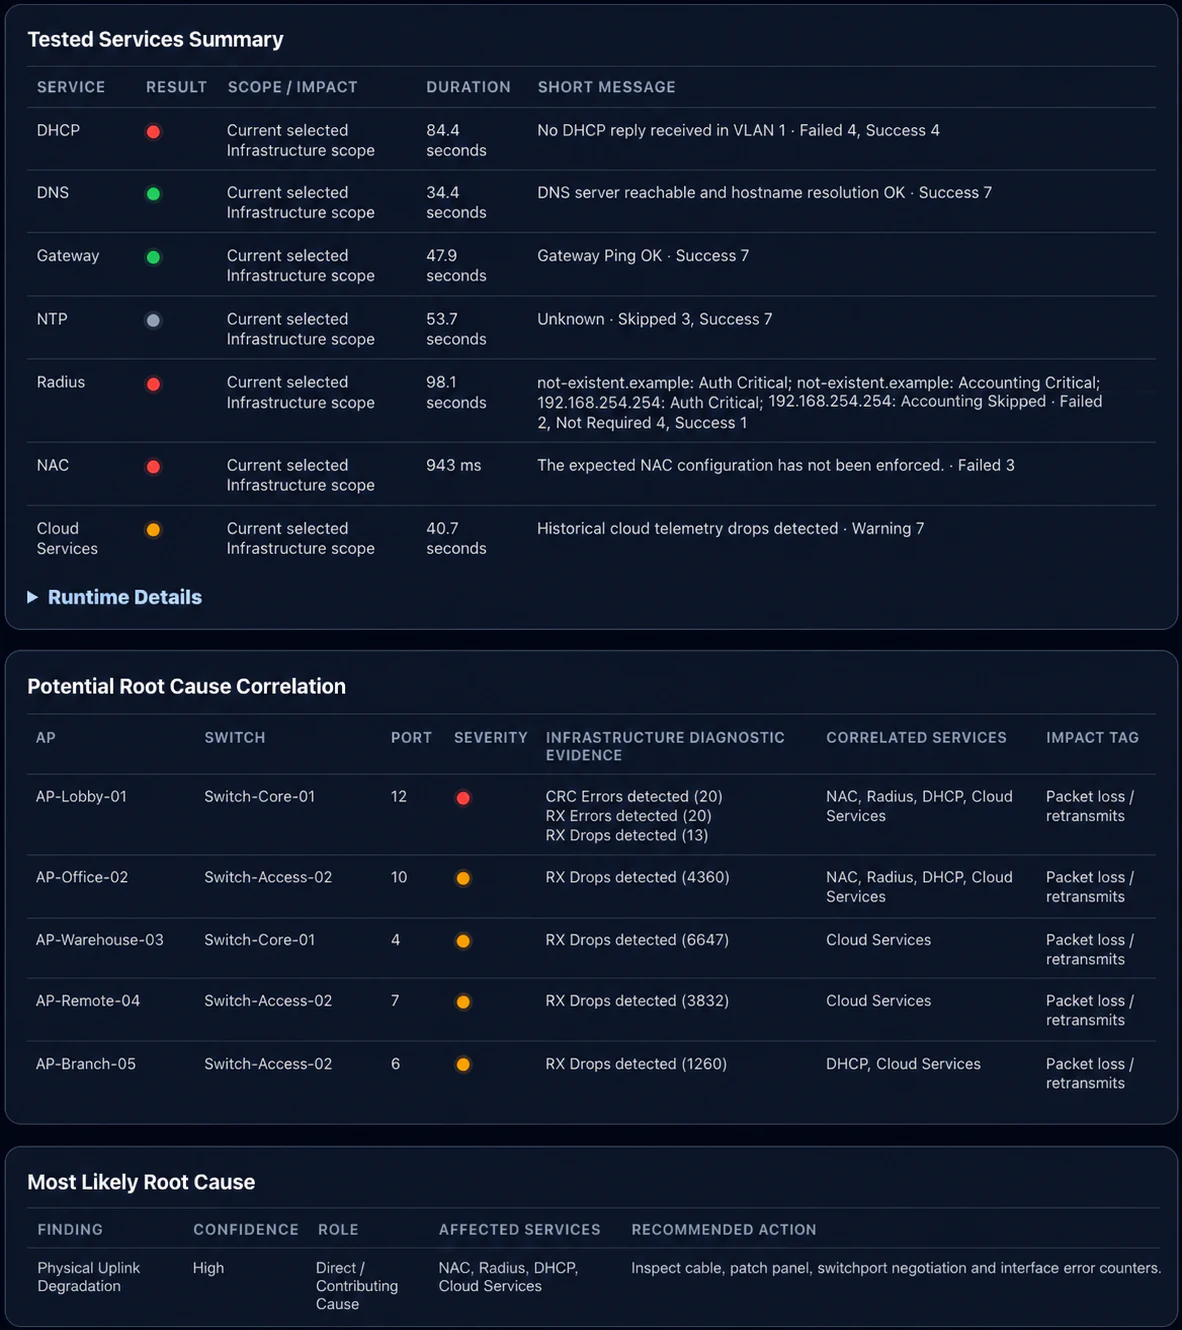
Correlation, affected infrastructure, recommended action, and a full or issue report.
Real product views
The data is synthetic, but Scope Explorer, the Service Matrix, and report output reflect the platform's actual operations workflow.
Example scenario
A site reports slow DHCP assignment and interrupted application sessions. The demo shows how Control combines service results, AP status, link counters, and switch-port evidence to reveal a damaged uplink as the likely common cause.
Safe demo
All names, sites, clients, SSIDs, and technical values in the demo are synthetic. The environment has no connection to production customer systems.